Ten-Year Smart Beta Small-Cap Value Charts
Caveat: The exceptional performance of the 4 SBSCV ETFs (EES, PRFZ, EZM, and RWJ) in these charts includes the recovery from the worst bear market since 1929. Here's what is most important about the charts: They show the continuing superior performance of EES, PRFZ, EZM, and RWJ vs appropriate Small-cap Value ETFs (IJS, VBR, IWN) and SPY, the S&P 500 de facto benchmark.
PRFZ outperforms over 10 years.

| Asset | 10 Year Return |
|---|---|
| PRFZ: PowerShares FTSE RAFI US 1500 Small-Mid | 308% |
| IJS: iShares S&P SmallCap 600 Value ETF | 227% |
| VBR: Vanguard Small-Cap Value ETF | 205% |
| SPY: SPDR S&P 500 ETF | 198% |
| IWN: iShares Russell 2000 Value ETF | 154% |
EZM outperforms over 10 years.
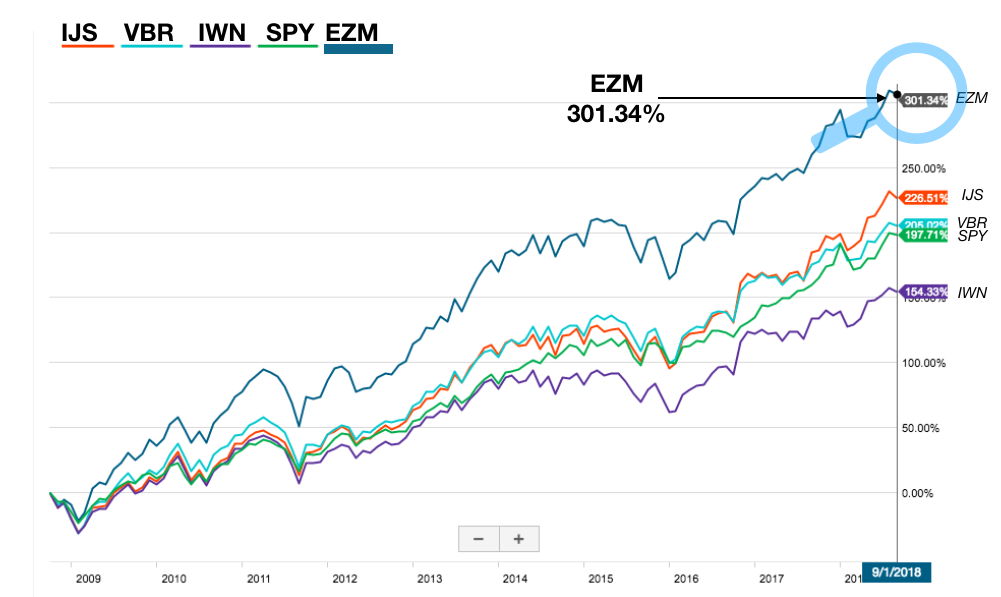
| Asset | 10 Year Return |
|---|---|
| EZM: WisdomTree MidCap Earnings ETF | 301% |
| IJS: iShares S&P SmallCap 600 Value ETF | 227% |
| VBR: Vanguard Small-Cap Value ETF | 205% |
| SPY: SPDR S&P 500 ETF | 198% |
| IWN: iShares Russell 2000 Value ETF | 154% |
RWJ outperforms over 10 years.

| Asset | 10 Year Return |
|---|---|
| RWJ: Oppenheimer S&P SmallCap 600 Revenue ETF | 322% |
| IJS: iShares S&P SmallCap 600 Value ETF | 227% |
| VBR: Vanguard Small-Cap Value ETF | 205% |
| SPY: SPDR S&P 500 ETF | 198% |
| IWN: iShares Russell 2000 Value ETF | 154% |
EES — you guessed it! — outperforms over 10 years.

| Asset | 10 Year Return |
|---|---|
| EES: WisdomTree U.S. SmallCap Earnings ETF | 302% |
| IJS: iShares S&P SmallCap 600 Value ETF | 227% |
| VBR: Vanguard Small-Cap Value ETF | 205% |
| SPY: SPDR S&P 500 ETF | 198% |
| IWN: iShares Russell 2000 Value ETF | 154% |